Analysis of Trace Metals in Some Drinking Water Sources Around Odugbo, Apa Local Government Area of Benue State, Nigeria
| Received 23 Nov, 2024 |
Accepted 07 Jan, 2025 |
Published 10 Jan, 2025 |
Background and Objective: The inadequacy of quality water in Odugbo Town, Benue State is almost endemic, and this study was conducted to investigate the trace metal level in some selected drinking water in Odugbo, Apa Local Government Area, Benue State, Nigeria. Materials and Methods: The 625 samples of the various drinking water sources in the various villages of Nigeria were obtained, and trace metal analysis was carried out using the Atomic Absorption Spectrophotometric method. The AAS traces the metal determination of Al, Fe, Ba, Pb, Zn, Cu, Cr, As, Ni, Cy, Hg, and Cd. The t-test analysis was conducted using SPSS Version 25, with a significance level of p<0.05, and descriptive statistics including means, standard deviation, and p-value. Results: The analysis of water samples showed varying concentrations of trace metals including: Al, Fe, Ba, Pb, Zn, Cu, Cr, As, Ni, Cy, Hg, and Cd. The Al, Cr, As, Ni, and Cd levels exceeded the NIS/SON:977-2017 standards for potable water. Conclusion: These findings highlight the need for stricter enforcement of water quality regulations, and improved water treatment processes to ensure safe drinking water, in line with WHO standards.
| Copyright © 2025 Okolo et al. This is an open-access article distributed under the Creative Commons Attribution License, which permits unrestricted use, distribution, and reproduction in any medium, provided the original work is properly cited. |
INTRODUCTION
Water as an essential commodity should be available to all, and sundry without a cost but in the case of Nigeria, reverse is the case.
During the colonial government in Nigeria, water was supplied to the public free, but water supplies to cities, and towns today, attract rates, and fees which has contributed to a shortage of quality potable water provisions for Nigerians1.
Pure water does not exist in nature, it is not possible to find pure water in nature even rainwater, when it chops just emitting from the clouds may be considered pure, but as the drops fall, it mixes with gases and gets dissolved in it, and makes it impure. Water is essential for the existence of life; it seems to be in abundance on the earth. Nevertheless, its 97.5% is saline, mostly in the form of seas, oceans salty lakes, etc., while the freshwater just makes 2.5%2.
The contamination of the water is not limited to bacteria but also dissolved in organic matter, dissolved elements, and trace metals. The dissolved elements such as Calcium (Ca2+), Magnesium (Mg2+), total hardness, Chloride (Cl–), Iron (Fe2+, 3+), Carbonates (CO32–), Bicarbonate (HCO3–), alkalinity, Acidity Nitrate (NO32–), Nitrite (NO2–), and trace metals such as Nickel (Ni), Zinc (Zn), Lead (Pb), Cadmium (Cd), Copper (Cu), Arsenic (As) etc. These are not desirable in water amounts for consumption because of their detrimental effect on health. The Federal Ministry of Environmental Saddle with environmental protection has established a maximum contaminant level (MCL) for these dissolved elements. The inorganic materials that the maximum contaminant levels have established are generally toxic in one manner or the other. They are well-known poisons, and can exhibit chronic or acute toxicity depending on the concentration3.
Though pure water does not or hardly exists in nature, pure water is supposed to be water that is colorless, odourless, and tasteless, and has a pH of 7. The pH of water is the measure of acidity or alkalinity in water. Natural water supplies are usually in the pH range of 6-8, whereas industrially contaminated waters can have any value in the range of pH 1-13, and require neutralization to pH 7 before discharge4.
The purity, and suitability of water for the purpose for which water is required depends largely upon the source from which they are derived5.
The quality of water depends on the use it went to be put into. There are harmful, and un-harmful impurities. So, in water treatment, these harmful impurities need to be removed. So potability of water depends on the constituents of a particular water. Daud et al.2 assert that “such water which does not contain other salts an impurities either good for health or un-harmful to health is called potable or wholesome water”.
No living cells can survive without water because of the vital roles they play in the metabolism processes, and must be preserved from every form of contamination4. Even though 70% of the earth’s surface is covered with water, pure water does not exist in nature, even rainwater as it emit from the sky, combines with atmospheric gases, and dissolves in the water, even microorganisms get dissolved in them. Despite this quantity, most of it is unsafe , and unfit for consumption. With about 1,500 million m3 of water available on our planet. Daud et al.2 affirm that the “total amount of fresh water available is only about 84.4 million m3”.
From the foregoing, the need to make water safer, and available for the rural populace due to the inadequacy of pipe-borne water in Odugbo is almost endemic, and affordability of public water supply in Odugbo in Apa Local Government Area of Benue State is difficult. Hence boreholes, well water, and sachet water is an alternative water for drinking to the public.
Adekunle et al.1 affirm that the inadequacy of the quality, and quantity of public supply is a major problem which makes water sachet hard, and are sold at an affordable price at least for the middle class of the society.
However, this alternative drinking water source has qualities that leave much to be desired. The source of chemical constituents has upper ranges above those recommended by the World Health Organization (WHO). The health implications of these on the people, both on an immediate or long-term basis, might not be too good for society.
With this understanding, it will be necessary for one to ascertain the level of contamination of a particular source of water through an analytical process to know the end of treatment to be given to a particular water.
The objectives of any water treatment, and purification is the collection of water from any available sources, and making it pass through treatment processes that will remove the undesirable substances, and add additives that can improve the quality of the water such as taste, odor, appearance, and other physicochemical, and microbiological parameters of the water might be detrimental to public health5.
This study investigated the quality of the drinking water sources in the study area. The research work involves the collection, and laboratory analysis of the various water samples available in the study area to ascertain their portability quality in the area of the physicochemical constituents vis-a-vis their conformity with the SON/NIS requirements, and the WHO standard for drinking water.
MATERIALS AND METHODS
Description of the study area: This research work was carried out in the rainy seasons from May to September, 2024 because this is the time when rainwater, and river water will be readily available for sampling. Even the river, and well waters sometimes dry up during the dry season, which necessitates the choice of the time of the research work.
Benue State falls within Longitude 7°47', 10°0'E, and Latitude 6°25', 8°8'N, the state shares boundaries with five states, they are Nasarawa to the North, Taraba to the East, Cross River to the South, Enugu to the South-West, Kogi to the West while it shares international boundary with the Republic of Cameroon to the Southeast.
Odugbo is in the Apa Local Government Area, and was first created on 23 March, 1981. The local government is located in the Northwestern part of Makurdi, the capital of Benue State. It is bounded to the North by Agatu Local Government, to the East by Gwer West, to the South by Otukpo, and to the West by Omala Local Government Area of Kogi State. Some of the villages that surround Odugbo are Ebugodo, Oba, Obinda, Opaha, Ikobi, Olekle Angwa, and Ikampo. It has population of about 1,000 people with a population density of about, and a few Igalas, and other settlers.
Sample collection: Five villages were selected randomly from among the villages around Odugbo one bag of 20 sachets per brand each of two different brands of sachet water available in retail shops in the villages was purchased, and analyzed for trace metals, this was done five different times.
At the same time, one sample of well water, rainwater, and river water was also collected on different days. One sample per day for 5 days each from five villages. The samples were collected in 2.5 L plastic kegs, and labeled accordingly.
The pH, and the conductivity of the water samples were measured in situ, at the time of sampling.
Altogether, 625 samples of the various drinking water sources in the various villages were sampled, and taken into the laboratory for the trace metal determination.
Analysis of water samples: Water samples were analyzed using an Atomic Absorption Spectrophotometer (AAS). From each water sample collected, 150 mL of water was taken, and preserved by adding 1.0 mL Conc. HNO3 is pooled, and then stored in a refrigerator to stabilize the metals for up to 2 weeks. From the pool 100 mL water sample was filtered , and concentrated to about 60 mL. Using a 100 mL standard flask 5 mL of HNO3 was added, and made to make with de-ionized water, and was turned using Unicom 969 AAS. About 1% was HNO3 used as blank. The metal concentration of the water samples was read off from a standard curve6:
Where:
| A | = | Concentration of metal in digested solution (mg/L) | |
| B | = | Final volume of digested solution (mL) | |
| C | = | Sample size |
Use of AAS was based on Beer-Lambert’s Law:
Where:
| I0 | = | Intensity of incident light | |
| It | = | Intensity of transmitted light | |
| a | = | Molar absorptivity | |
| b | = | Thickness of medium | |
| c | = | Concentration |
Thus, the concentration, and logarithmic of the transmittance are proportional to the absorbance. The procedures employed are as indicated in the AAS manufacturer’s manual.
Reagent and glassware:
| • | Reagents used were analaR grade | |
| • | Distilled water was used throughout the study | |
| • | Glassware/apparatus washed thoroughly and oven-dried | |
| • | 0.1 m HNO3 was used |
The presence of trace elements such as cadmium, and lead in the environment calls for concern as their presence can be felt in water, air, and soil which are sources of worry to environmentalists, government agencies in charge of environments, and health, and health practitioners7. This is because they have adverse effects on our health, are non-essential, and have little benefits to man as they are required in little quantity8. Copper, selenium, and other trace elements are required in micro quantity which perform some roles in living cells. Some of them are essential components of enzymes that attract substrate molecules that facilitate the conversion to particular end products but can affect growth, reproduction, and other biological activities in high concentrations adversely7,8.
Statistical analysis: The t-test analysis, and the software used in this research work is SPSS Version 25. The significance level is p<0.05, and the descriptive statistics used include means, standard deviation, and p-value, respectively
RESULTS AND DISCUSSION
In the analysis of the data obtained from the analysis of the various water samples, the SPSS Version 25 was used, as presented in Table 1. The significance level used in determining the p-value is p<0.05. The result shows the mean value, standard deviation, and p-value. The various p-value of the samples show that the various water samples analyzed have a similar level of concentration of trace metals because the water samples are mostly well water, rainwater, and river water which are supposed to have agreed with the null hypothesis which shows the samples analyzed is very consistent with the null hypothesis. With this high p-value, it implies weak evidence against the null hypothesis making the rejection of it not possible. This makes it clear that the trace metal levels of the various water sources are generally high in the study area as shown in the p-value presented.
|
| Table 1: | Showing the parameters, mean value, standard deviation and p-value | |||
| Parameter | Mean value | Standard deviation | p-value |
| Aluminium | 0.0000 | ±0.0135 | 0.9571 |
| Copper | 0.2400 | ±0.2916 | 0.6180 |
| Iron | 0.2400 | ±0.2273 | 0.6694 |
| Zinc | 0.6523 | ±0.9540 | 0.5000 |
| Arsenic | 0.0600 | ±0.0409 | 0.8960 |
| Barium | 0.0000 | ±0.0126 | 0.9595 |
| Cadmium | 0.0000 | ±0.0070 | 0.9753 |
| Chromium | 0.0000 | ±0.0409 | 0.9844 |
| Cyanide | 0.0000 | ±0.0024 | 0.9902 |
| Lead | 0.0000 | ±0.0024 | 0.9902 |
| Nickel | 0.0000 | ±0.0087 | 0.9703 |
| Mercury | 0.0000 | ±0.0000 | NaN |
| Source: Researchers field survey and NaN: Not a number | |||
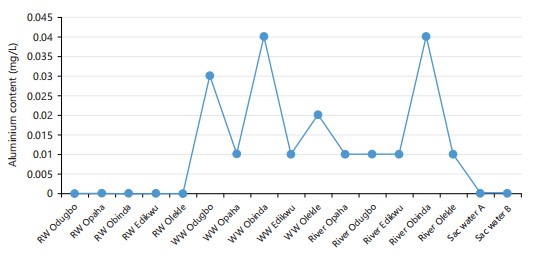
Mean value of Aluminium (Al) in mg/L: In Fig. 1, the mean values of Aluminium (Al) plotted against the various water samples analyzed, show that WW (Odugbo, Opaha, Obinda, Edikwu), River (Odugbo, Opaha, Obinda, Edikwu) values of 0.03, 0.01, 0.04, 0.01, 0.02, 0.01, 0.01, 0.04, and 0.01 mg/L, respectively but WW Odugbo, Obinda, and River Obinda recorded 0.03, 0.04, and 0.04 which are higher than the NIS/SON requirements, and WHO standards of 0.05 mg/L for potable water while the remaining water sources are within the 0.02 mg/L.
Mean value of Iron (Fe) in mg/L: In Fig. 2, the mean values of Iron (Fe) plotted against the various water samples analyzed, show that RW Odugbo, WW Odugbo, WW Edikwu, and WW Olekle have Iron values of 0.87, 0.51, 0.45, and 0.45 mg/L, respectively, which are higher than NIS/SON requirements, and WHO standards of 0.3 mg/L for potable water. The work of Adeniola et al.9 that has 0.5 mg/L as the mean value of iron in the water analyzed shows an agreement with this work.

|

|
Mean value of Barium (Ba) in mg/L: In Fig. 3, the mean values of Barium (Ba) plotted against the various water samples analyzed, show that RW Odugbo, Opaha, Edikwu, Olekle recorded no Barium while other water sources recorded values of 0.01-0.04 mg/L, respectively. The 0.04 mg/L was recorded by River at Opaha. All the water samples analyzed show values of Barium falling below the maximum value of 0.05 mg/L for potable water as recommended by NIS/SON requirements, and WHO standards.
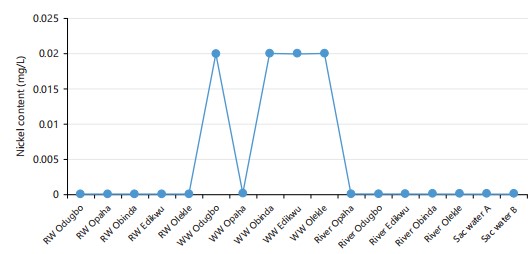
Mean value of Nikel (Ni) in mg/L: In Fig. 4, the mean values of Nickel (Ni) plotted against the various water samples analyzed, show that all other samples have no Nickel recorded while WW Odugbo, WW Obinda, and WW Olekle have Nickel (Ni) value of 0.02 mg/L, respectively which is higher that NIS/SON requirements, and WHO standards of 0.01 mg/L for potable water. This aligns with the works of Adeniola et al.9 which have means values of 0.07, 0.045, and 02 mg/L, respectively for the various water analyzed.
Mean value of Zinc (Zn) in mg/L: In Fig. 5, the mean values of Zinc (Zn) plotted against the various water samples analyzed show that all the water recorded the presence of Zinc in them which ranges from 0.01-2.14 mg/L, and were within the NIS/SON requirements, and WHO Standards limits for potable water. This tallies with the works of Adeniola et al.9 which have mean values of zinc as 0.11, 0.12, and 0.11 mg/L, respectively for the various water analyzed.
|

|
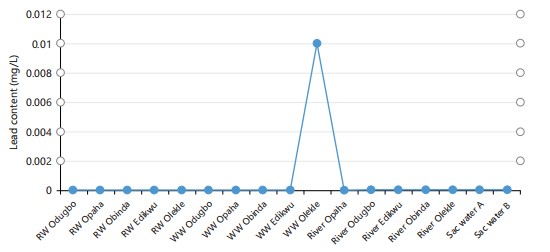
Mean value of Lead (Pb) in mg/L: In Fig. 6, the mean values of Lead (Pb) plotted against the various water samples analyzed, show that all the water samples have 0 mg/L respectively except WW Olekle, which has a mean value of 0.01 mg/L which is much lower than the NIS/SON requirements, and WHO standards of 0.05 mg/L for potable water. This is in deviance with the work of Aderinola et al.9 which has a mean value of Pb as 0.14 mg/L of the water analyzed.
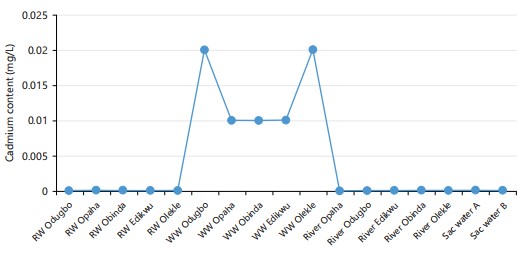
Mean value of Cadmium (Cd) in mg/L: In Fig. 7, the means values of Cadmium (Cd) plotted against the various water samples analyzed, show that all the well water (WW) from Odugbo, Opaha, Obinda, Edikwu, and Olekle has a value ranging between 0.01-0.02 mg/L while other water samples recorded 0 mg/L. The result shows that the values of Cadmium fall within the NIS/SON requirement, and WHO standard for potable water. This is in agreement with the work of Yusuf and Osibanjo10 with the mean value of Cd as 0.05 mg/L.
|
|
Mean value of Copper (Cu) in mg/L: In Fig. 8, the mean values of Copper (Cu) plotted against the various water samples analyzed, show that RW (Odugbo, Opaha, Obinda, Edikwu, Olekle), WW (Odugbo, Opaha, Obinda, Edikwu), River (Odugbo, Opaha, Obinda, Edikwu), and SW A, and B values of 0.027, 0.03, 0.03, 0.03, 0.03, 0.15, 0.65, 0.66, 0,66, 0.45, 0.06, 0.66, 0.06, 0.04, 0.03, 0.03, and 0.01 mg/L, respectively which are less than the NIS/SON requirements, and WHO standard s of 0.05 mg/L for potable water. This is in agreement with the work of Adeniola et al.9 which has mean valued Cu 0.06, 0.4, and 0.045 mg/L. from the various water analyzed.
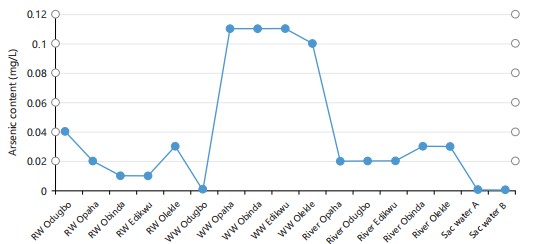
Mean value of Arsenic (As) in mg/L: In Fig. 9, the mean values of Arsenic (As) plotted against the various water samples analyzed, show that RW (Odugbo, Opaha, Obinda, Edikwu, and Olekle), WW (Opaha, Obinda, Edikwu), and River (Odugbo, Opaha, Obinda, and Edikwu) values of 0.04, 0.02, 0.01, 0.1, 0.03, 0.11, 0.11, 0.11, 0.11, 0.1, 0.02, 0.02, 0.02,0.03, and 0.03 mg/L, respectively which are above the NIS/SON requirements, and WHO standard s of 0.01 mg/L for potable water. This is in agreement with the work of Mebrahtu and Zerabruk11 which has mean values as 0.0395, 0.0603 , and 0.052 mg/L from the various water analyzed.

|
|
Mean value of Chromium (Cr) in mg/L: In Fig. 10, the mean values of Chromium (Cr) plotted against the various water samples analyzed, show that RW (Opaha, Edikwu, and RW Olekle), and WW Odugbo have values of 0.012, 0.01, 0.01, 0.01, and 0.01 mg/L, respectively which are within limits of the NIS/SON requirements , and WHO standards of 0.01 mg/L for potable water except for that of RW Odugbo with 0.012 mg/L which is slightly above the limits. This is partly in agreement with the work of Anake et al.12 which has to mean valued Cr 0.097, 0.104, and 0.098 mg/L from the various water analyzed.
Mean value of Cyanide (Cy) in mg/L: In Fig. 11, the mean values of Cyanide (Cy) plotted against the various water samples analyzed, show that RW (Odugbo, Opaha, Obinda, Edikwu), RW Olekle), WW (Odugbo, Opaha, Obinda, Edikwu), River (Odugbo, Opaha, Obinda, Edikwu, Olekle) 0 mg/L, respectively except WW Olekle that recorded 0.01 mg/L which are within the NIS/SON requirements, and WHO standards of 0.01 mg/L for potable water. This is in deviance with the work of Obiri et al.13 which has mean values Cy 0.0848, 0.0741, and 0.1358 mg/L from the various water analyzed.
Mean value of Mercury (Hg) in mg/L: In Fig. 12, the mean values of Mercury (Hg) plotted against the various water samples analyzed, show that RW (Odugbo, Opaha, Obinda, Edikwu,Olekle), WW (Odugbo, Opaha, Obinda, Edikwu), River (Odugbo, Opaha, Obinda, Edikwu), and SW A, and B values of 0 mg/L, respectively which are less than the NIS/SON requirements, and WHO standards of 0.001 mg/L for potable water, and agrees with the WHO standard for drinking water.

|

|
The mean values of Al, Fe, Ni, Pb, Cd, Cr, Ba, Hg, As, Zn, Cy, and Cu observed in this study show that higher mean values were recorded in the following: WW Odugbo, WW Obinda, and River Obinda has for Al, RW Odugbo, WW Opaha, WW Odugbo, and WW Olekle for Fe, RW Odugbo, RW Opaha, RW Olekle, River Obinda, and River Olekle for As, RW Odugbo for Cr, and WW Odugbo, RW Obinda, RW Edikwu, and RW Olekle for Ni, respectively are higher than the NIS/SON requirements, and WHO standards for potable water. All other trace metals are within limits in all other sources as per analytical at the time of the report of this research work. This could be a result of human activities such as open-air solid waste combustion, quarrying, road construction, dissociation of the bedrock of the watercourse, sawing of woods in neighboring bushes, airborne particulates, discharge of agricultural, and fecal matter drainage, which might find their ways into the water body of River Okpokwu that traverse through the different villages in the study area. Also, the geological strata of the rock, and the soil of the dug well might be a contributory factor to the high trace metal levels in the water.

|
The finding is in consonance with the work of Taweel et al.14, who found the concentration of trace metals in the range of 0.27-0.680 mg/L for Fe, 0.02-0.09 mg/L for Zn, 0.06-0.22 mg/L for Pb, and 0.001-0.008 mg/L for Cd in tap water samples in Ibadan, Southwestern, Nigeria.
The results obtained in this research work are in agreement with the work of Adekunle et al.1, who concluded that “higher trace metals concentration in wet seasons implies increase in soil metal burden from the atmospheric deposit of air particulates by wet precipitate, and subsequent rainwater run-offs of waste materials. Metal levels could also be traced to dissociation from the bedrock through which the water flows. Copper enters the water system through mineral dissolution, and industrial effluents".
The presence of lead in some of the river waters analyzed shows conformity with the work of Adeniola et al.9, which reveals that metal pollution of rivers in Nigeria may be due to industrial discharges, corrosion of iron, and steel materials in building, leachates from dump sites, and vehicles. High lead concentrations in some surface water samples have been attributed to the use of leaded petrol vehicles.
CONCLUSION
The study reveals that trace metals such as Nickel, Aluminium, Arsenic, Chromium, and Iron exceed NIS/SON, and WHO limits in most water samples, posing potential health risks to consumers. The widespread presence of these trace elements is likely due to seepage from rainfall, and increased contamination from soil, and chemicals. High levels were particularly noted in water from dug wells, and rivers, possibly linked to water hardness. The findings suggest that rainwater, and sachet water are safe for consumption, highlighting the urgent need for accessible, clean potable water to prevent waterborne diseases in the area.
SIGNIFICANCE STATEMENT
The study identified that there are various water used as sources of drinking in the study area, the quality needs to be tested to know whether it is of good quality or is short of the desired quality of potable water. This study will help uncover the critical areas that cause possible contamination of the water sources, and the types of contaminants that could be present in the water sources. This will help in the suggestions of ways of mitigating the possible problems that might be discovered from the research work findings.
REFERENCES
- Adekunle, L.V., M.K.C. Sridhar, A.A. Ajayi, P.A. Oluwade and J.F. Olawuyi, 2004. An assessment of the health and social economc implications of satchet water in Ibadan, Nigeria: A public health challenge. Afr. J. Biomed. Res., 7: 5-8.
- Daud, M.K., M. Nafees, S. Ali, M. Rizwan and R.A. Bajwa et al., 2017. Drinking water quality status and contamination in Pakistan. BioMed Res. Int., 2017.
- McGhee, T.J. and E.W. Steel, 1991. Water Supply and Sewerage. 6th Edn., McGraw-Hill, New York, United States, Pages: 602.
- Porteous, A., 2008. Dictionary of Environmental Science and Technology. 4th Edn., Wiley, Hoboken, New Jersey, ISBN: 978-0-470-06195-4, Pages: 832.
- Punmia, B.C., A.K. Jain and A.K. Jain, 2012. Water Supply Engineering. 2nd Edn., Laxmi Publications, Darya Ganj, Delhi, ISBN: 9788131807033, Pages: 584.
- McNaught, A.D. and A. Wilkinson, 1997. Compendium of Chemical Terminology: IUPAC Recommendations. 2nd Edn., Blackwell Science, Oxford, United Kingdom, ISBN: 9780865426849, Pages: 450.
- Awofolu, O.R., Z. Mbolekwa, V. Mtshemla and O.S. Fatoki, 2005. Levels of trace metals in water and sediment from Tyume River and its effects on an irrigated farmland. Water SA, 31: 87-94.
- Fleeger, J.W., K.R. Carman and R.M. Nisbet, 2003. Indirect effects of contaminants in aquatic ecosystems. Sci. Total Environ., 317: 207-233.
- Aderinola, O.J., V. Kusemiju and E.O. Clarke, 2012. Trace metal distribution in surface water, sediment, and tissues of freshwater catfish (Clarias. Gariepinus), from Oke-Afa Canal, Lagos Nigeria. Int. J. Geogr. Geol., 1: 10-22.
- Yusuf, K.A. and O. Osibanjo, 2006. Trace metals in water and sediments from Ologe Lagoon, Southwestern. Pak. J. Sci. Ind. Res., 49: 88-96.
- Mebrahtu, G. and S. Zerabruk, 2011. Concentration and health implication of heavy metals in drinking water from urban areas of Tigray Region, Northern Ethiopia. Momona Ethiopian J. Sci., 3: 105-121.
- Anake, W.U., N.U. Benson, A.A. Akinsiku, C.O. Ehi-Eromosele and I.O. Adeniyi, 2014. Assessment of trace metals in drinking water and groundwater sources in Ota, Nigeria. Int. J. Sci. Res. Publ., 4.
- Obiri, S., D.K. Dodoo, F. Okai-Sam and D.K. Essumang, 2007. Determination of free cyanide and total cyanide concentrations in surface and underground waters in Bogoso and its surrounding areas in Ghana. Bull. Chem. Soc. Ethiop., 21: 213-220.
- Taweel, A., M. Shuhaimi-Othman and A.K. Ahmad, 2013. Assessment of heavy metals in tilapia fish (Oreochromis niloticus) from the Langat River and engineering lake in Bangi, Malaysia, and evaluation of the health risk from tilapia consumption. Ecotoxicol. Environ. Saf., 93: 45-51.
How to Cite this paper?
APA-7 Style
Okolo,
O.P., Esther,
A.O., Mshelmbula,
E.Y. (2025). Analysis of Trace Metals in Some Drinking Water Sources Around Odugbo, Apa Local Government Area of Benue State, Nigeria. Research Journal of Botany, 20(1), 26-37. https://doi.org/10.3923/rjb.2025.26.37
ACS Style
Okolo,
O.P.; Esther,
A.O.; Mshelmbula,
E.Y. Analysis of Trace Metals in Some Drinking Water Sources Around Odugbo, Apa Local Government Area of Benue State, Nigeria. Res. J. Bot 2025, 20, 26-37. https://doi.org/10.3923/rjb.2025.26.37
AMA Style
Okolo
OP, Esther
AO, Mshelmbula
EY. Analysis of Trace Metals in Some Drinking Water Sources Around Odugbo, Apa Local Government Area of Benue State, Nigeria. Research Journal of Botany. 2025; 20(1): 26-37. https://doi.org/10.3923/rjb.2025.26.37
Chicago/Turabian Style
Okolo, Onoja, Paul, Adekiya O. Esther, and Eric Yohanna Mshelmbula.
2025. "Analysis of Trace Metals in Some Drinking Water Sources Around Odugbo, Apa Local Government Area of Benue State, Nigeria" Research Journal of Botany 20, no. 1: 26-37. https://doi.org/10.3923/rjb.2025.26.37

This work is licensed under a Creative Commons Attribution 4.0 International License.